Identifying and quantifying what you are observing will allow you to produce visuals of trends and patterns.
Identify Plants and Insects
Note common plants and creatures such as spiders, insects, pollinators, wildlife, and even domesticated animals. How are they are interacting with landscape features and each other.

Some resources:
- Botany Language Basics for Identification of Flowering Plants (pdf)
- Insects in the Garden
- Online identification field guides such as BugGuide and Discover Life
- Project BudBurst provides descriptions and photos to help identify species and similarly does the National Phenology Network Nature’s Notebook project on the plants and animals page while Project Budbreak provides a manual for plant phenology observers
- Cornell’s Lab of Ornithology yardmap project local resources has native plant listings and a pollinator guide for your ecoregion. You might also connect with a Native Plant Society to identify plants native to your area
Identify Site Features and Characteristics
- Examine soil texture and composition. Is it clayey, loamy, sandy? Dry or wet? Consider getting a so
 il test.
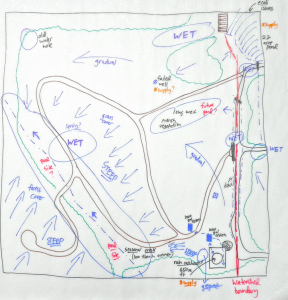
 - Make a map of your site—identify on the map where certain plants/soil types/areas are located.
- Determine which plant hardiness zone your site is located in.
- Identify some of the specific plant species/cultivars you observed growing on your property site.
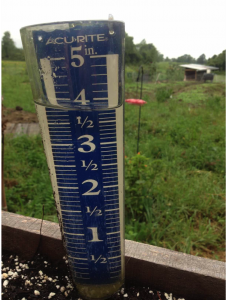
- Identify how much rainfall your area usually gets? How much sunlight does each part of your site receive?
- Identify native and invasive plant species around your property.
Some resources:
- Soil Basics and Soil Testing
- Google Earth or Google Maps can help you visualize and make a map of your site
- USDA Hardiness Zone map. NYS weather and climate maps
- CoCoRaHS (Community Collaborative Rain, Hail & Snow Network) includes precipitation data (rain, snow, hail), temperatures (averages, highs, lows) and pattern throughout the year on evapotranspiration and solar radiation as well as drought impact reporting and detection.
- Check out the history data on Weather Underground
- Print publication: Site Assessment for Better Gardens and Landscapes
Identify Patterns
- Are there any places in the garden/property that are frequently inundated with water, or are more susceptible to drying out? Record the month/time and duration this usually occurs. (If you made a map including the terrain of your site, you may want to refer to it as a guide for where these places may be)
- Mark the dates and weather conditions on which the plant shows developments of the first leaf, first bud, first flower, full bloom, and die-off.

- When (what month/time of day) do you generally use the most water? Are there any garden practices that enable you to use less?
- Quantify any damage that occurs to your plants (via pathogens, deer, insects, mites) and also the time it takes for the plant to recover (if it does). Did any variables induce these changes? Is there a type of damage a certain plant is resilient to and, are there some plants that are more resilient than others? Was yield affected?


